NavCanada's own noise footprints are misleading and outdated.
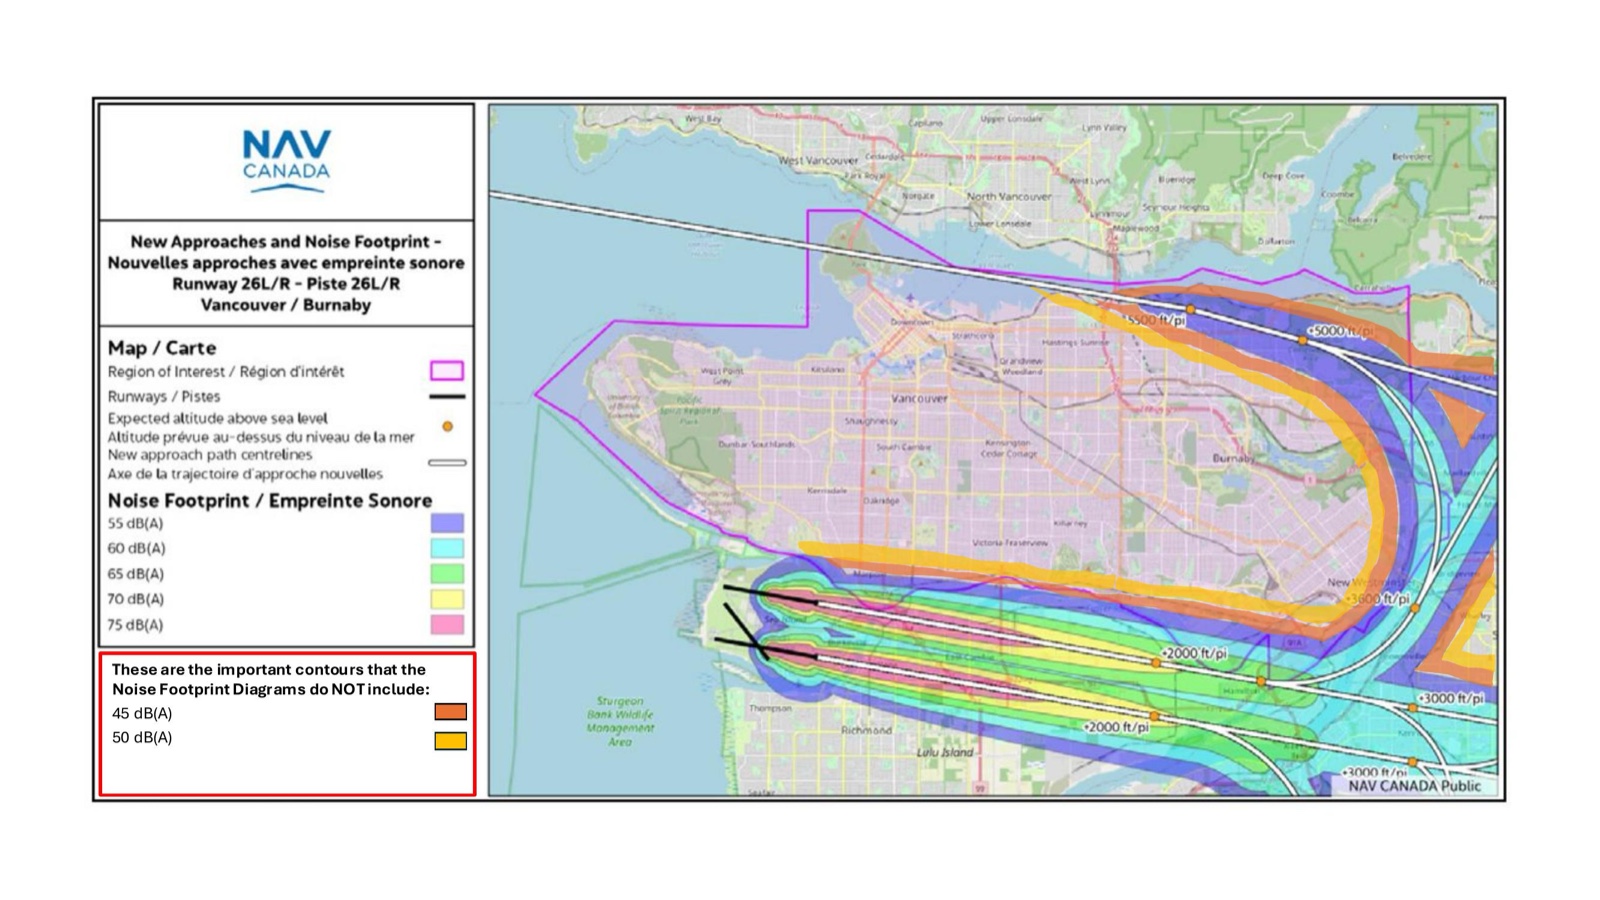
The diagram NavCanada did not want you to ask about. Their published contours begin at 55 dB(A) (blue). The 45 dB(A) and 50 dB(A) contours — the health-relevant thresholds defined by the World Health Organization — were never drawn. The real noise footprint extends far beyond the coloured zone shown here.
Do the math yourself: where the missing contours are
Aircraft noise from a flight corridor decays at approximately 3 dB per doubling of distance from the path centerline — the standard line-source approximation used in acoustic modelling. Working outward from NavCanada's published 55 dB(A) boundary:
The exact contour would require running NavCanada's own acoustic model (the FAA's AEDT, or its equivalent). But the direction of the error is always the same: NavCanada's published diagram understates the affected zone — never overstates it.
Honest caveat: WHO's 45 dB(A) threshold is a long-term nighttime average (Lnight). NavCanada's contours may use different metrics (Lden, Lmax, SEL). The comparison is not one-to-one — but the core point holds: the contours that matter most for sleep and long-term health were simply not drawn.
World Health Organization Recommendations
WHO Guideline
45 dB
Maximum recommended aircraft noise exposure for good health
NavCanada's Current Levels
55-70 dB
Current average with peaks significantly higher
NavCanada implemented noise levels 22-55% HIGHER than WHO guidelines recommend for good health.
How Loud Will It Actually Be?
Real noise data from the UK's National Air Traffic Services (NATS) shows the peak noise level (Lmax) produced by different aircraft types at various altitudes. These are the kinds of planes that fly into YVR every day.
| Aircraft Type | Examples | 2,000-3,000 ft | 3,000-4,000 ft |
|---|---|---|---|
| Single-aisle jet 125-180 seats |
Boeing 737, Airbus A320 | 64-69 dB | 61-64 dB |
| Twin-aisle jet 250 seats |
Boeing 777, 787, Airbus A330 | 68-74 dB | 64-68 dB |
| Large twin-aisle 300-350 seats |
Boeing 777-300, Airbus A340 | 67-73 dB | 63-67 dB |
| 4-engine widebody 400+ seats |
Boeing 747, Airbus A380 | 71-78 dB | 67-72 dB |
For context: Normal conversation is about 60 dB. A vacuum cleaner is about 70 dB. The WHO recommends aircraft noise stay below 45 dB for health. Every 10 dB increase sounds roughly twice as loud to the human ear.
Watch: The Quietest Year
A Documentary About What Aircraft Noise Does to Communities Like Ours
This film shows exactly what happens when flights start routing over quiet neighbourhoods. Sleep destruction. Children falling behind in school. Heart disease. It's not hypothetical -- it's documented.
Watch The Quietest Year Official SiteHear It for Yourself
NATS Noise Measurement
Audio clips of aircraft of different types at different heights, with background sounds for context. From the UK's air traffic control authority.
Measure It Yourself (iOS)
NIOSH Sound Level Meter app. Point your phone at the sky next time a plane passes and see the decibels for yourself.
Measure It Yourself (Android)
NIOSH Sound Level Meter for Android. Free, accurate, and developed by the US government.
Flight Path Maps & Noise Contours
These maps show the current flight paths and noise impact zones over our communities.
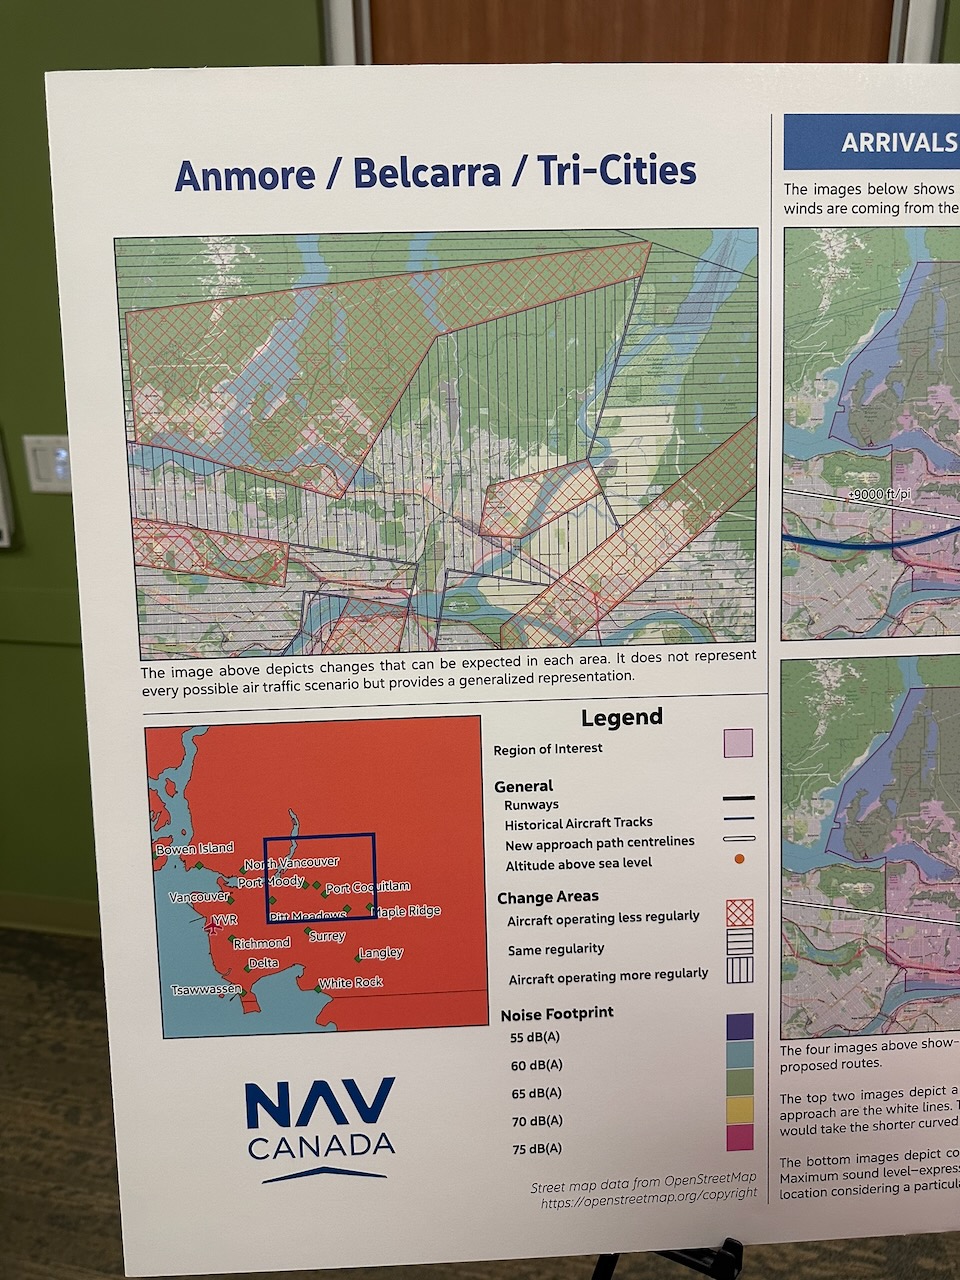
Official NavCanada consultation board showing the Anmore/Belcarra/Tri-Cities region. The noise footprint legend shows contours from 55 dB(A) through 75 dB(A). Red cross-hatching indicates areas where aircraft will operate less regularly; vertical lines indicate more regular aircraft operations.
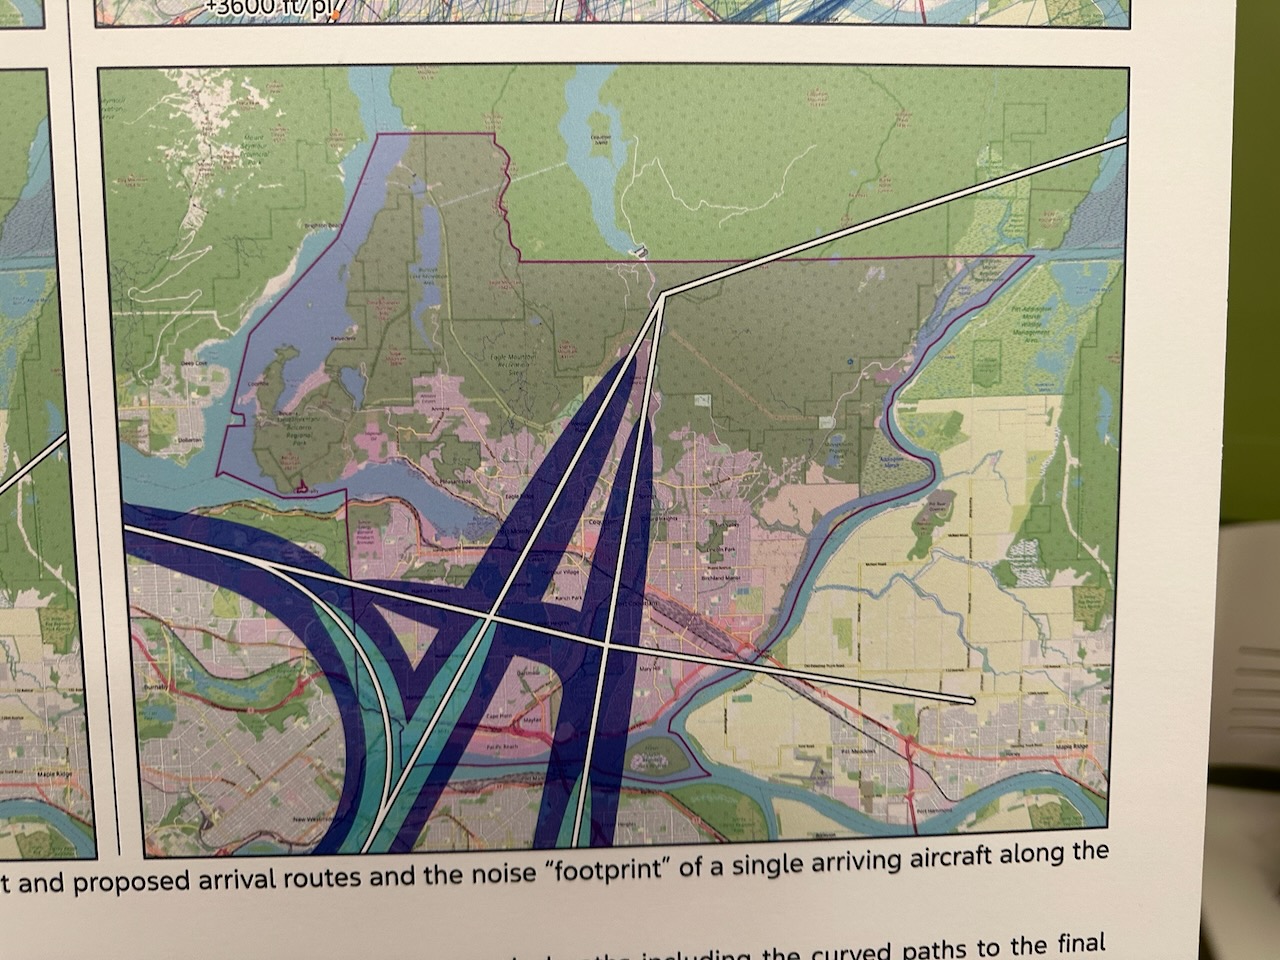
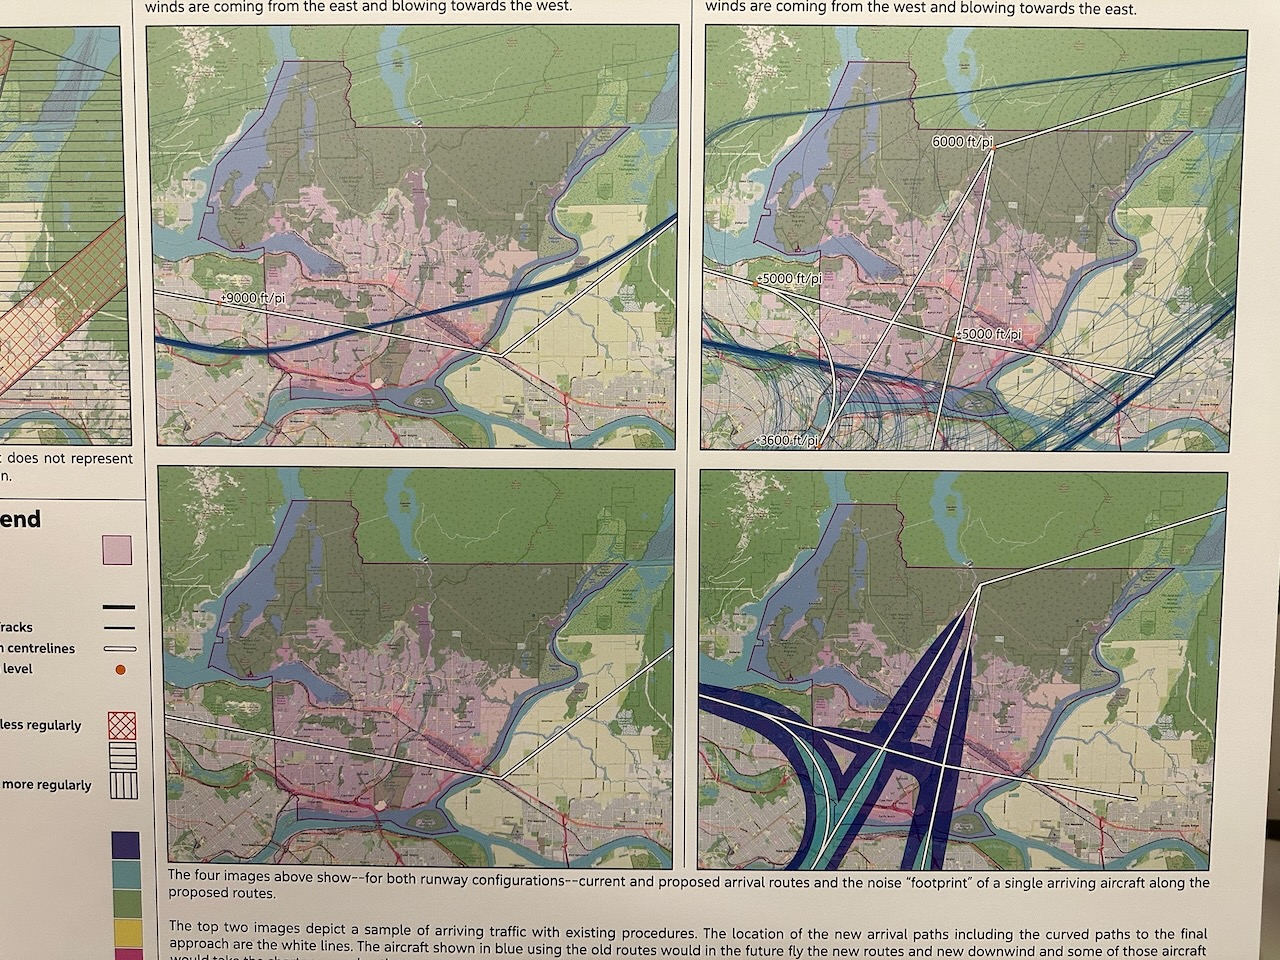
Current arrival routes and the noise footprint of a single arriving aircraft. The dark blue/purple areas show the most intense noise impact, with white lines indicating the approach paths including curved paths to the final approach.
Before and after comparison showing previous and current arrival routes for both runway configurations. Left panels show previous traffic patterns; right panels show current routes now active. The routes previously shown in blue are now being flown according to the new routes shown in white.
Every statistic on this page, cited
- NavCanada starts contours at 55 dB(A) only: NavCanada Vancouver Airspace Modernization public consultation materials, 2022. NavCanada VAMP page
- WHO 45 dB(A) nighttime maximum for health: WHO Environmental Noise Guidelines for the European Region (2018). Read guidelines
- 5 dB(A) = doubling of perceived noise: Human auditory perception — a 10 dB increase sounds roughly twice as loud; the relationship is logarithmic. See WHO guidelines above and acoustical references at NIDCD / NIH.
- Aircraft Lmax noise levels (64-78 dB(A)) by aircraft type: UK National Air Traffic Services (NATS) Representative Aircraft Lmax Data. NATS Lmax data
- WHO night noise recommendations (< 30 dB in bedrooms): WHO Night Noise Guidelines for Europe. Read guidelines (PDF)
- 903,000 DALYs lost annually / 900,000 hypertension cases in Europe: WHO Regional Office for Europe (2011), "Burden of disease from environmental noise." Read report
- The Quietest Year documentary: Official site. thequietestyear.com